


Results and reports, built for real teaching decisions
After every Wooclap session, your results are ready, no processing, no waiting. Browse responses question by question, filter by participant, or open the Grid view to see every answer side by side. Export in PDF or Excel, send personalised reports directly to learners, or sync data to your LMS.

From raw answers to actionable insight
See the full picture instantly
Results are available as soon as the session ends, grouped by question, by participant, or across the full session. No spreadsheets to build, no manual tallying. The data is structured and ready to read the moment you need it.
Spot what was missed, not just what was right
The Questions view shows how the group answered each item, useful for identifying which concepts landed and which didn't. The Grid view shows every participant's individual answers across all questions at once, making it easy to spot patterns and outliers.
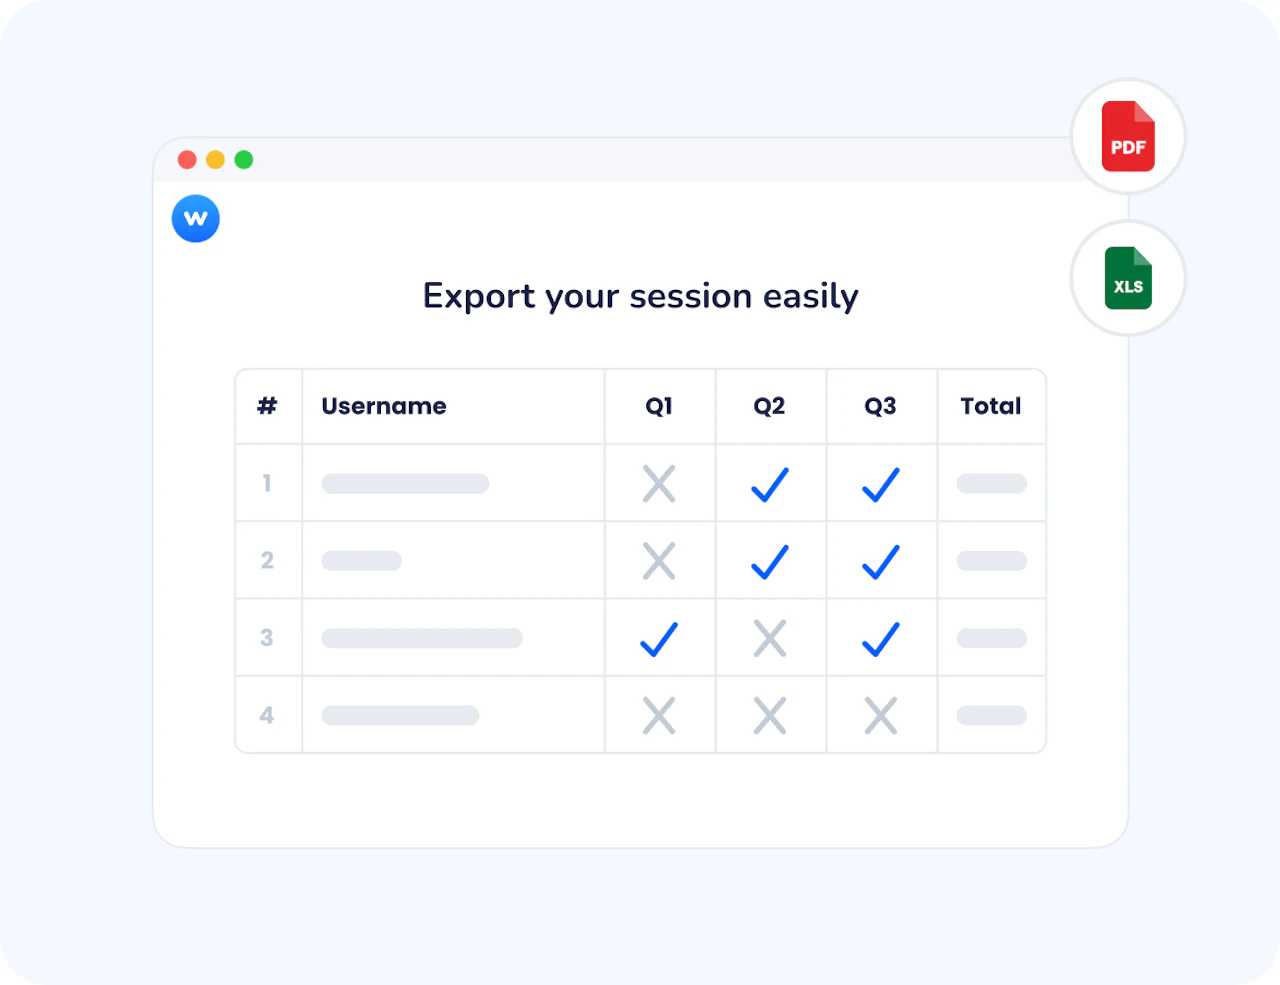
Export, share, and sync without extra steps
Download results in Excel or PDF with one click. Send each participant their own personalised report. Sync grades, attendance, and participation data directly to your LMS gradebook. No manual transfer, no reformatting.
The difference between knowing scores and understanding learning
A percentage score tells you who got things right. The Results and Grid views tell you why gaps exist, which questions tripped up which students, which concepts need revisiting, and where to spend time in the next session. That's the difference between a score and a useful insight.
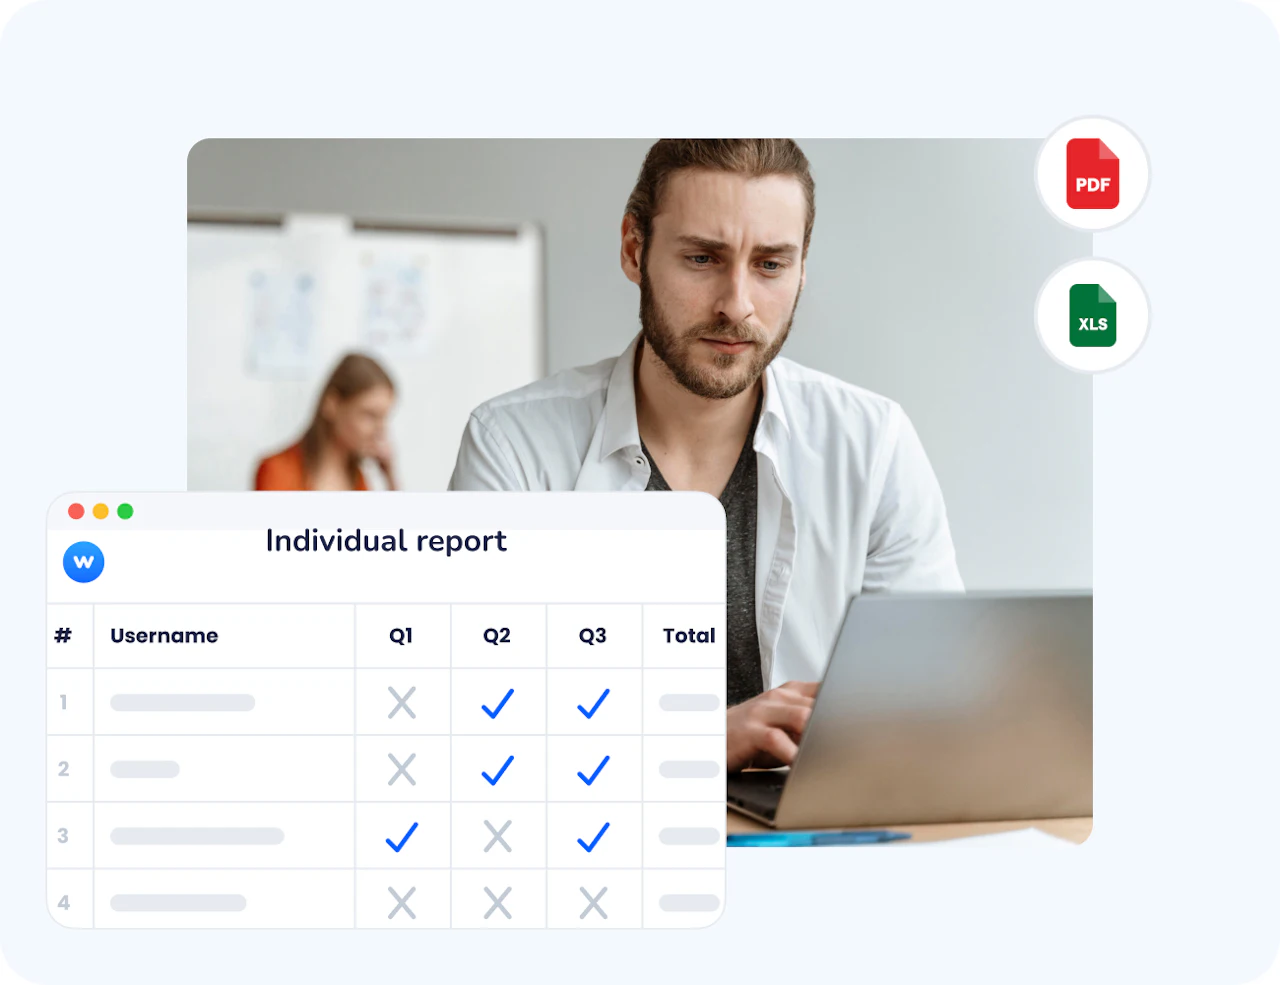
Feedback that goes back to the learner
Individual reports give each participant a clear record of their own answers alongside the correct ones. They can review what they got wrong and why, turning a short session activity into a concrete learning moment. One click sends the report to everyone who participated.
How Results and Reports work
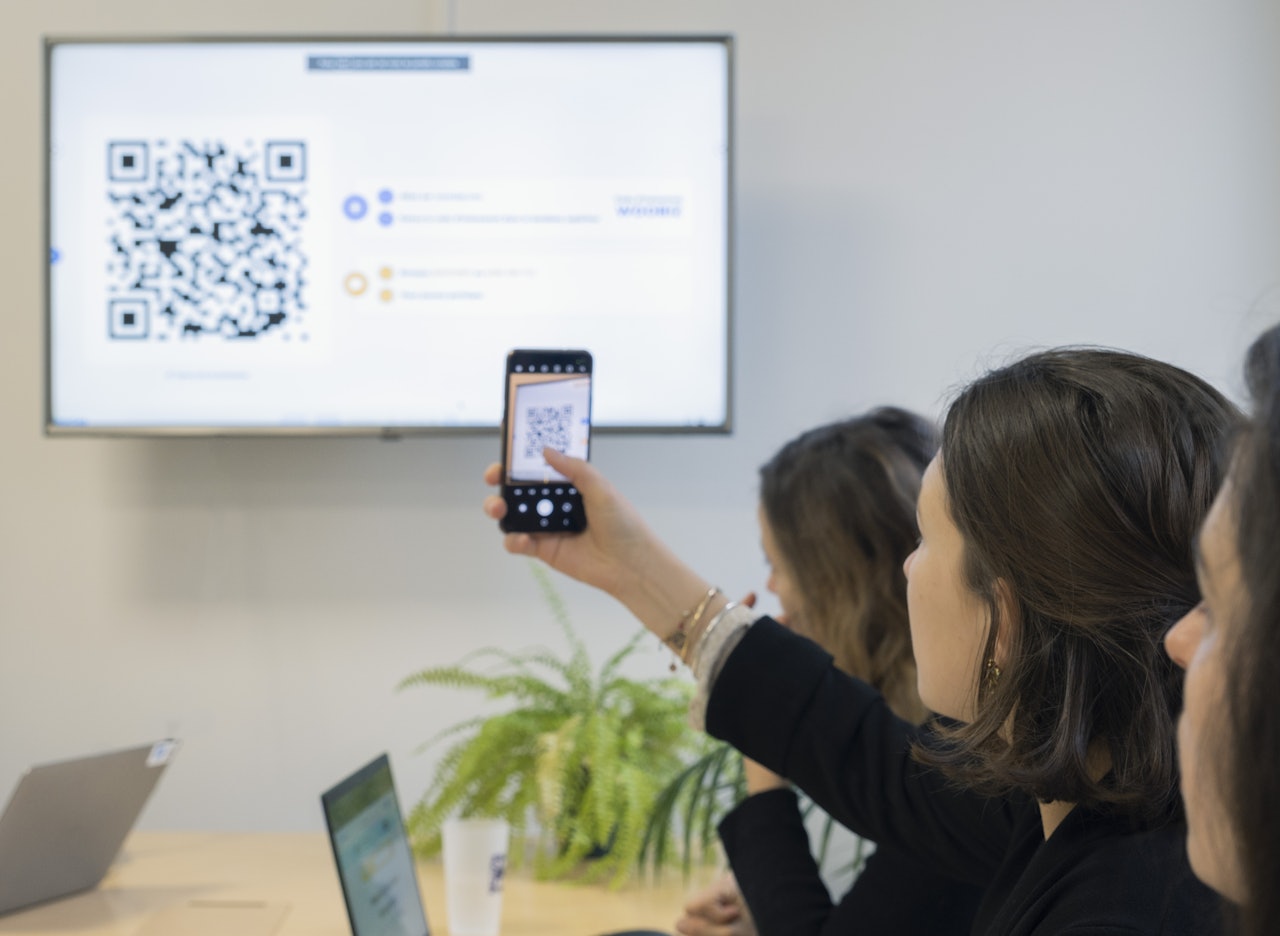
Open your results after the session
Once your event ends, go to Settings → Results → Reports. Choose your view: the Questions view for a question-by-question breakdown, the Participants view to filter by person, or the Grid view to see all answers per participant across all questions in a single table.
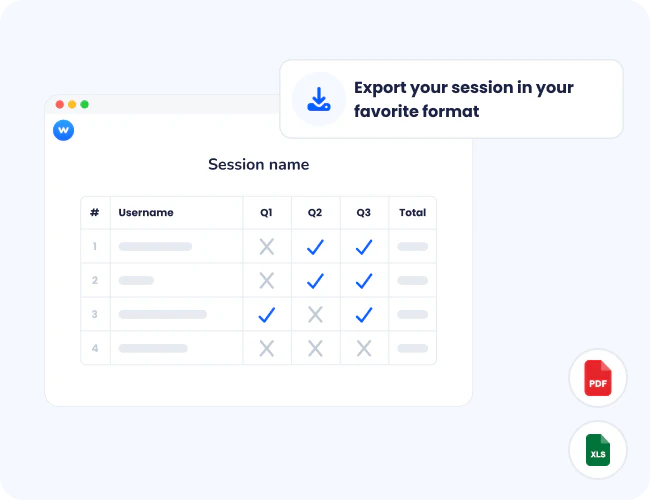
Export in the format you need
Click Save as PDF to download a formatted report of your session results. Click Export to Excel for a full data file, including all answers, participant data, scores, and Message Wall messages in separate tabs. To export all events at once, use the Export results of all events option from your account home page.
Share with learners or sync to your LMS
Send personalised individual reports to each authenticated participant with one click, they receive an email with a link to their own results. If your institution uses an LMS, sync grades, attendance, or participation data directly to the gradebook via LTI or Moodle integration.
How teachers and trainers use Results and Reports
Results and Reports are most useful right after a session, and in the days that follow, when you need to decide what to do next based on concrete data.
Lecture debriefs
Professors review how students answered each question after a lecture, identify the two or three concepts that generated the most errors, and open the next session by addressing exactly those gaps.
Formative assessment & grading
Instructors use the Grid view to check individual performance across a quiz session, export the Excel file for their records, and send each student their personalised report for self-review.
Training evaluation & compliance reporting
Trainers export PDF or Excel reports after a workshop to document participation and outcomes, useful for compliance audits, certification records, or sharing results with L&D managers.
Tracking progress over time
Using Comparison mode, instructors run the same event with two cohorts or at two different points in the year, then compare results side by side to measure learning gains or identify persistent gaps.
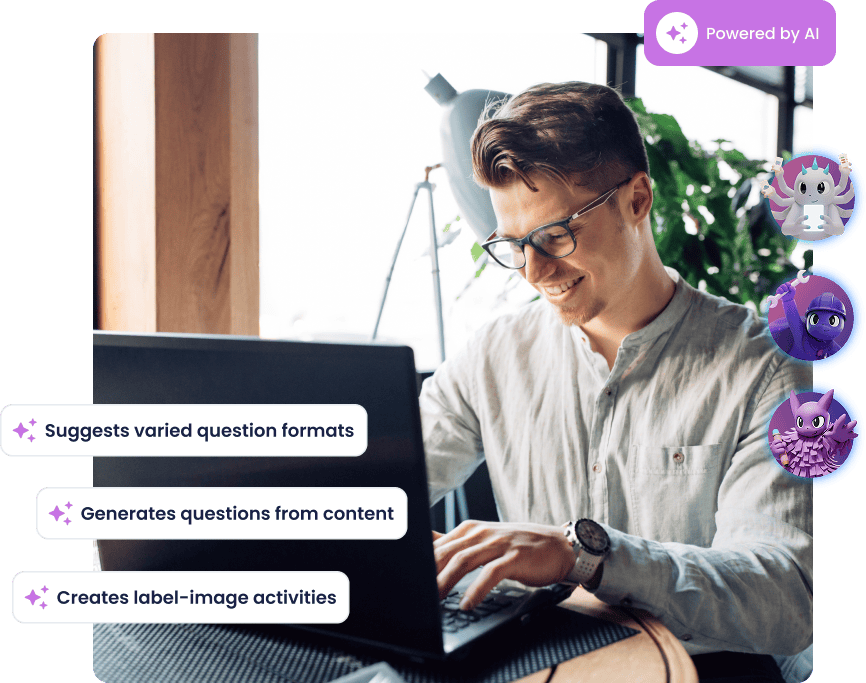
AI that supports effective formative learning
Wooclap's AI helps you create richer learning moments with less effort: it generates MCQ follow-up questions to reinforce understanding, groups open responses into clear themes, summarises brainstorming input, and suggests ideas to enrich any activity. These AI agents save time, surface misconceptions earlier, and help you focus on guiding deeper learning.
Sync attendance directly to your LMS

Canvas
Launch live or self-paced Wooclap activities directly inside your Canvas course. Scores appear instantly in the Canvas Gradebook, with secure SSO access for every student.

Moodle
Add interactive Wooclap activities to your Moodle course in just a few clicks. Automate grading, track participation, and keep everything centralized within Moodle.

Blackboard
Run interactive quizzes and polls directly within Blackboard using LTI integration. Students access activities through their institutional login, and results sync to the Grade Center.

Brightspace
Integrate Wooclap seamlessly into Brightspace to deliver interactive learning experiences. Sync assessment data and participation metrics directly into your Brightspace environment.
Everything you need to review, export, and act on session data
Questions view
Browse results question by question, see how the group answered each item, identify the most common errors, and understand where understanding fell short.
Grid view
See every participant's answers across all questions in a single table, a complete individual-level picture of the session, useful for performance reviews and grading.
Participants view
Filter results by participant to review a single learner's performance across all questions in the session.
Export in PDF or Excel
Download a formatted PDF for sharing, or a full Excel file with all answers, participant data, scores, and Message Wall messages in separate tabs.
Personalised individual reports
Send each authenticated participant their own results by email with one click, their answers, the correct answers, and their score, all in one linked report.
Comparison mode
Run the same event across two sessions or cohorts and compare results side by side, useful for pre/post assessments, repeat cohorts, or tracking learning progress over time.
Ready to see what your learners actually understood?
Create a session, run your activities, and open your reports, everything is structured and ready the moment the session ends.
Frequently asked questions
Have questions? We’ve got answers to help you get the most our your questions